So This Is What We Pay For
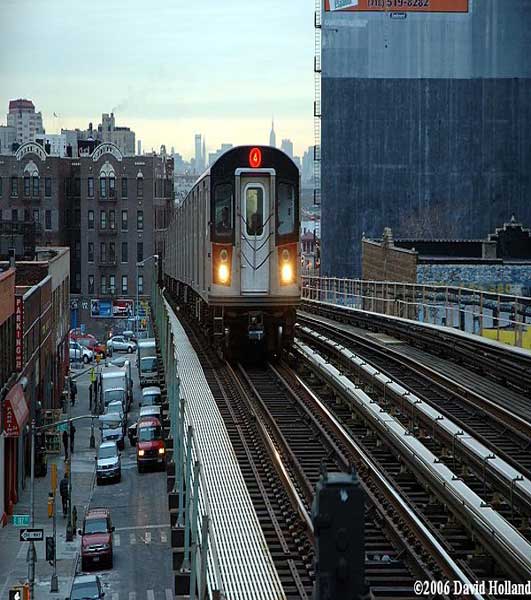
Woodlawn bound 4 train approaching the 183rd Street station. Resized photo courtesy of Eye On Transit
As I addressed in the previous entry, the MTA will most likely look to implement substantial fare hikes next year to help close the budget deficit that is nearing $900 million dollars. Now in that entry I mentioned how these fare hikes would come as we are continuing to have a decline in the amount of quality service. On Monday, the New York City Transit division of the MTA shared the results of a rise in subway delays which equaled 24% for the year ending in May. Annie Correal & Ray Rivera of the New York Times filed this report:
People who hazard the No. 4 subway line each day don’t need the numbers to tell them: It’s slow. Not just slow, it turns out, but of the city’s two dozen or so subway lines, its on-time performance is the poorest and getting worse, according to new statistics released on Monday by New York City Transit.
The figures were among a raft of dismal performance numbers included in a report to the board of the Metropolitan Transportation Authority, which oversees the transit agency. They included a 24 percent spike in the number of delays systemwide, measured over the year ending in May, the latest records available.
The indicators come as the authority is considering a second consecutive year of fare increases to help close a budget gap of nearly $900 million. Transit officials said at least some of the performance problems are tied to past budget cuts in subway car maintenance.
Click here to view their full report.
Now here are the full results of each line’s percentage of trains arriving at the terminal within 5 minutes of scheduled time:
 : May 2007: 92% / May 2008: 88%
 : May 2007: 80% / May 2008: 81%
 : May 2007: 86% / May 2008: 88%
 : May 2007: 80% / May 2008: 70%
 : May 2007: 86% / May 2008: 82%
 : May 2007: 92% / May 2008: 89%
 : May 2007: 94% / May 2008: 90%
 : May 2007: 92% / May 2008: 93%
 : May 2007: 96% / May 2008: 96%
 : May 2007: 96% / May 2008: 96%
 : May 2007: 96% / May 2008: 96%
 : May 2007: 96% / May 2008: 95%
 : May 2007: 94% / May 2008: 92%
 : May 2007: 98% / May 2008: 98%
 /
/ : May 2007: 99% / May 2008: 98%
 : May 2007: 95% / May 2008: 92%
 : May 2007: 99% / May 2008: 99%
 : May 2007: 95% / May 2008: 96%
 : May 2007: 98% / May 2008: 97%
 : May 2007: 95% / May 2008: 95%
 : May 2007: 94% / May 2008: 95%
 : May 2007: 95% / May 2008: 97%
The top reason for delays is track work. One of the major reasons for delays comes from straphangers holding doors. The other reasons consisted of sick passenger, unruly customer, signal trouble, & other. However before we just assume these results are accurate, lets not forget that these results are based on reports filed by train crews. So these results are unscientific to say the least.
I find it hard to believe that “straphangers holding doors” was not the cause for a bigger percentage of delays. Lets look at the way of life in the jungle known as the NYC Subway. Many straphangers will hold doors open to squeeze into a train as if it is the last train to freedom. Nevermind the fact that they could see the lights of the next train close behind. They must be on the specific train that is too packed for someone else to fit or they legitimately missed.
Is it of any surprise that the worse line for delays is one of the big 3 on the Lexington Avenue line, more specifically the train. It is truly a sad state on that line when it was the only line to score in the 70’s for on time performance indicators or more accurately a 70!
When I saw the results, I thought of a thread on the Straphangers Campaign’s Rider Diaries forum which called some Upper East Side riders oh the Lexington Avenue line maniacs. This sentiment was shared by some due to how many of these riders purposely hold up trains in stations due to the fact they feel it is their right not to miss the train they see even if the next one is most likely only a short time away from arriving.
I must say I find it surprising that the best performing lines were ones that normally get trashed by many for their service. However I want to focus on how the IRT lines have the bottom 6 in terms of on-time performance indicators. This can not be a coincidence & according to Rider Diaries member “Jamal BK3” it isn’t. He provided a very interesting reason as to what might be causing the IRT’s poor on-time performance. After reading his post, it makes a lot of sense especially based on what some employees have mentioned to me. You can read Jamal’s post by clicking here.
I could be here all day breaking down these numbers. Either way you slice it, overall service is behind where it should be & to ask as us to pay more is downright unfair to the riding public. Lets see if our elected officials will take notice as it will take more than vocal opposition from major leaders (I will get to that in the next entry) to fix this.
xoxo Transit Blogger
If you enjoyed this post, please consider to leave a comment or subscribe to the feed and get future articles delivered to your feed reader.

Comments
No comments yet.
Leave a comment